Geomechanics Module Updates
For users of the Geomechanics Module, COMSOL Multiphysics® version 5.3a brings three more soil material models and improved default plots, which you can read about in more detail below.
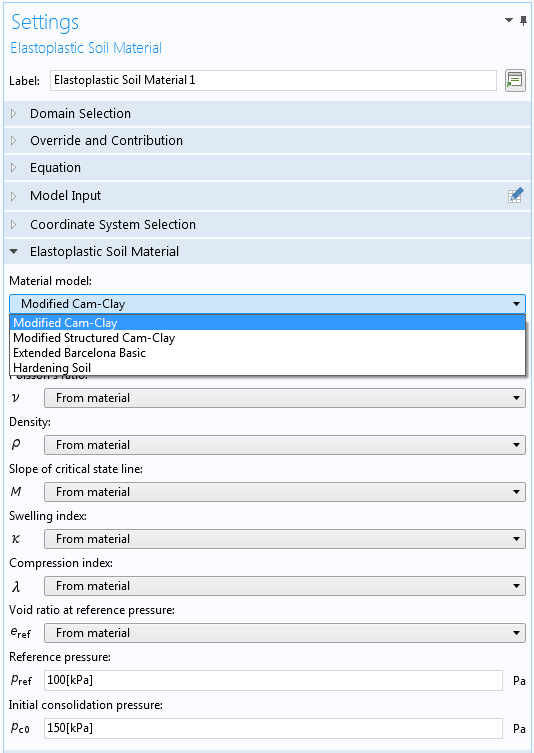
Elastoplastic Soil Material Models
A new family of soil material models has been added with the new Elastoplastic Soil Material feature in which the elastic and plastic behaviors are not independent. One such material model (Cam-Clay) existed in previous versions of the COMSOL® software and it has now been improved and renamed Modified Cam-Clay. The other three materials, commonly used in the geomechanics community, are Hardening Soil, Extended Barcelona Basic, and Modified Structured Cam-Clay.
Improved Default Plots
The default plots in the structural mechanics physics interfaces have been updated to produce more informative visualizations. The Application Library tutorials have been updated accordingly. Some of the more prominent changes that you will see are as follows:
- The color table for von Mises stress plots is RainbowLight
- The color table for mode shape plots, for eigenfrequency and linear buckling studies, is AuroraBorealis
- Mode shape plots have the legend switched off to emphasize that the amplitude of a mode does not have a physical meaning
- The color table for section force plots in the Beam and Truss interfaces is Wave, with a symmetric color range
- This makes it possible to immediately distinguish between tension and compression, for example
- In contact analysis, a plot of the contact pressure is added, as either a line plot (2D) or contour plot (3D)
- The default plot for Stress Linearization now has a legend for the graphs
- The default Undeformed geometry plot, produced by the Shell interface, has new colors
- When a material model like plasticity or creep is used, a contour plot of a relevant strain quantity, like the effective plastic strain, overlays the stress plot
- Applicable for the Nonlinear Structural Materials Module and the Geomechanics Module
- In the Fatigue interface, the Traffic color table is used for predicted cycles to failure and for usage factors
- Applicable for the Fatigue Module
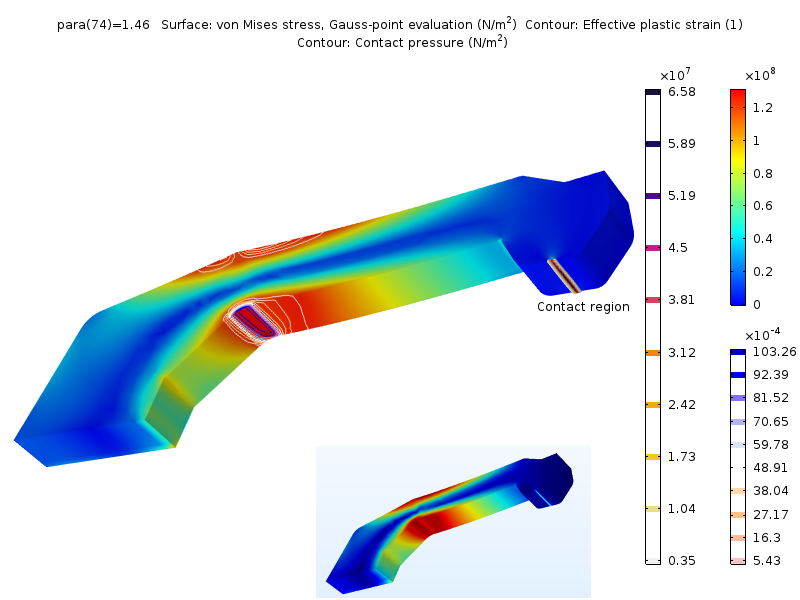 In this example, you can see brighter colors in the stress plot (RainbowLight color table), and plastic strain contours and contact pressure contours have been added by default. For comparison, a plot from the default plot in COMSOL Multiphysics® version 5.3 of the same model is shown.